- Keep track of how quickly human agents respond and resolve customer inquiries.
- Monitor the total number of handovers for the AI Agent.
- Summarize conversation statuses.
- Evaluate conversation types based on the assigned label.
This report’s metrics include sessions with personal data masked using the Delete Profile or Deactivate Profile Nodes.
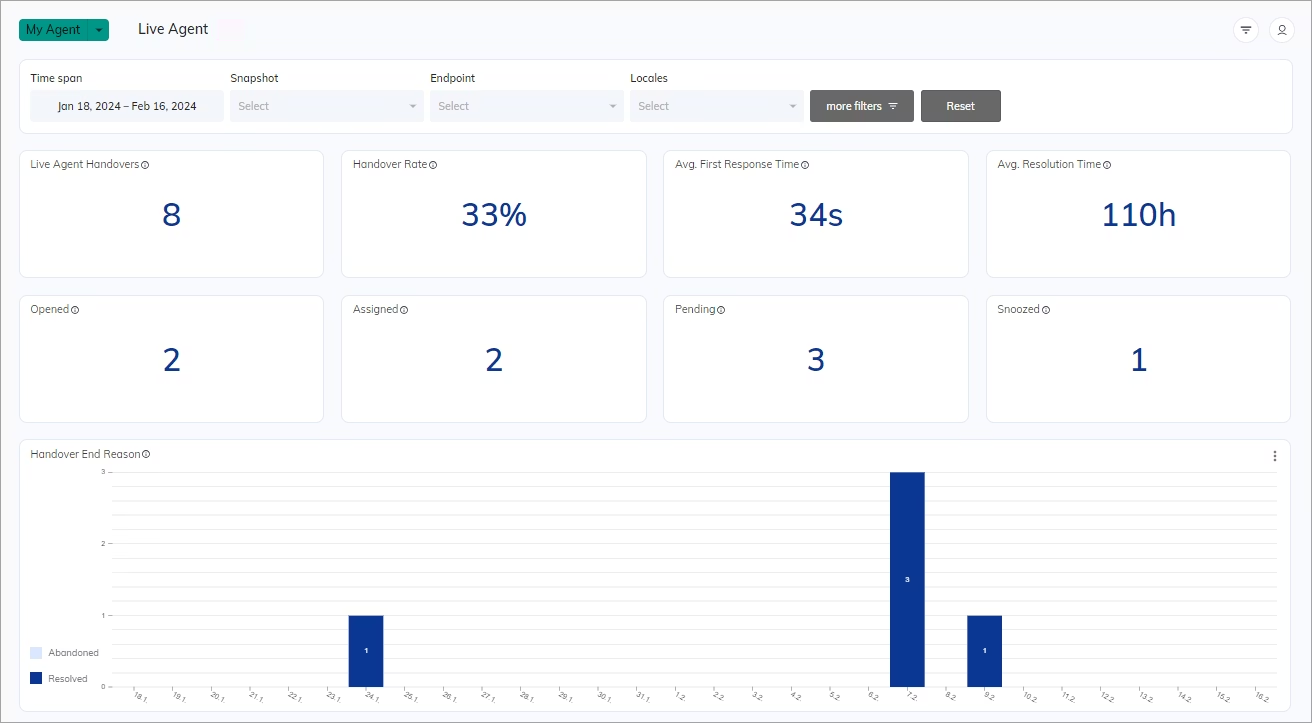
Indicators
The Indicator charts present real-time data that refreshes every 30 seconds.Live Agent Handovers
This overview shows the number of handovers. A handover occurs when an AI Agent transfers the conversation to a human agent. Multiple handovers can occur within a single session. Source table:7
Handover Rate
Displays the percentage of sessions needing human assistance. The handover rate is calculated as the ratio of Live Agent Escalations divided by total sessions. A lower value indicates fewer sessions needing human assistance. If multiple handovers occur during a session, Cognigy counts them as one escalation. Source table:(Number of Live Agent Escalations) / (Total Sessions) * 100%
Result: 60%
Avg. First Response Time
Displays the average time it takes for a human agent to send the first response to an end user. Source table:- For each session,
First response time - Request time. - Average first response time =
Total time to send a first response / Number of sessions
1 min 10 sec
Avg. Resolution Time
Displays the average time it takes a human agent to resolve a conversation after escalation. Source table:- For each session,
Resolving time - Request time. - Average resolution time =
Total Resolution time / Total number of sessions
9 min
Opened
Indicates the number of conversations that were opened by a user or reopened by a human agent.Assigned
Indicates the number of conversations that were assigned to a human agent.Pending
Indicates the number of conversations that were paused until a customer or human agent responded.Snoozed
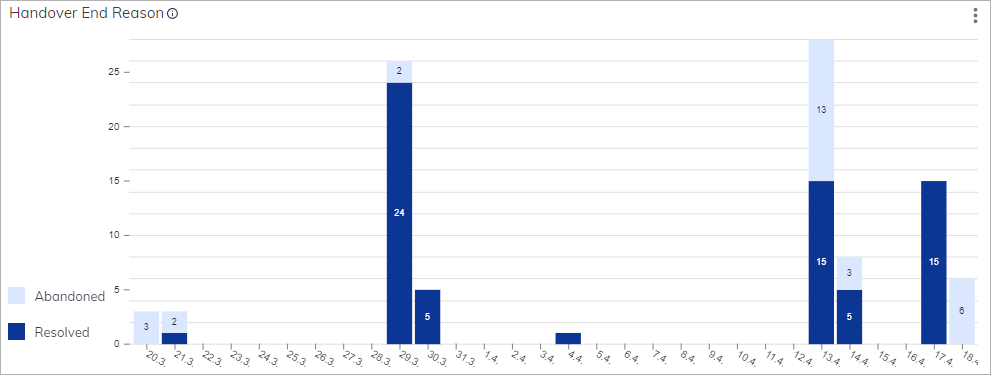
Indicates the number of conversations that were temporarily suspended until a time trigger or customer response trigger was activated.Bar charts
Handover End Reason
Displays the following conversation statuses on a timescale:- Abandoned — a conversation is closed because the user left the conversation.
- Resolved — a conversation is closed because the user’s problem was resolved.
Label Summary
Indicates Live Agents labels for categorizing and prioritizing conversations.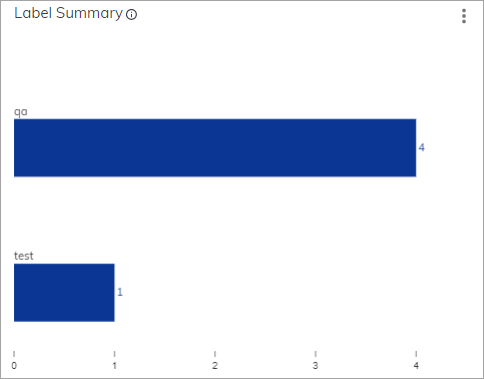
Line charts
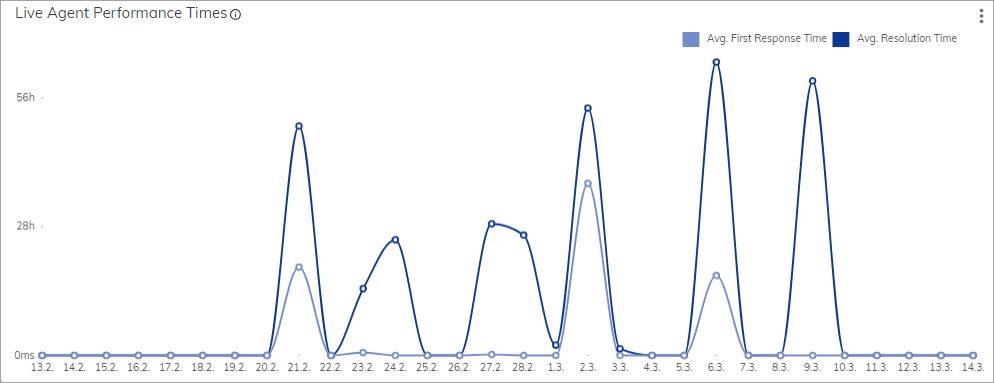
Live Agent Performance Times
Displays the average time to first response and resolution time for human agents. This metric is calculated based on the number of sessions and helps evaluate human agent effectiveness by comparing response and resolution times. The First Response Time metric refers to the average time a human agent takes to send a first response to a customer’s request. The Resolution Time metric refers to the average time of a customer’s interaction with a human agent, from the start of the handover sequence until the end of the session. Source tables: Result: